The steps below will guide you through resolving dashboard connection issues when Juan’s team reports that the dashboard is down, or when Transport Support receives a notification stating the gateway is unreachable.
Go to https://app.powerbi.com/signin and sign in.
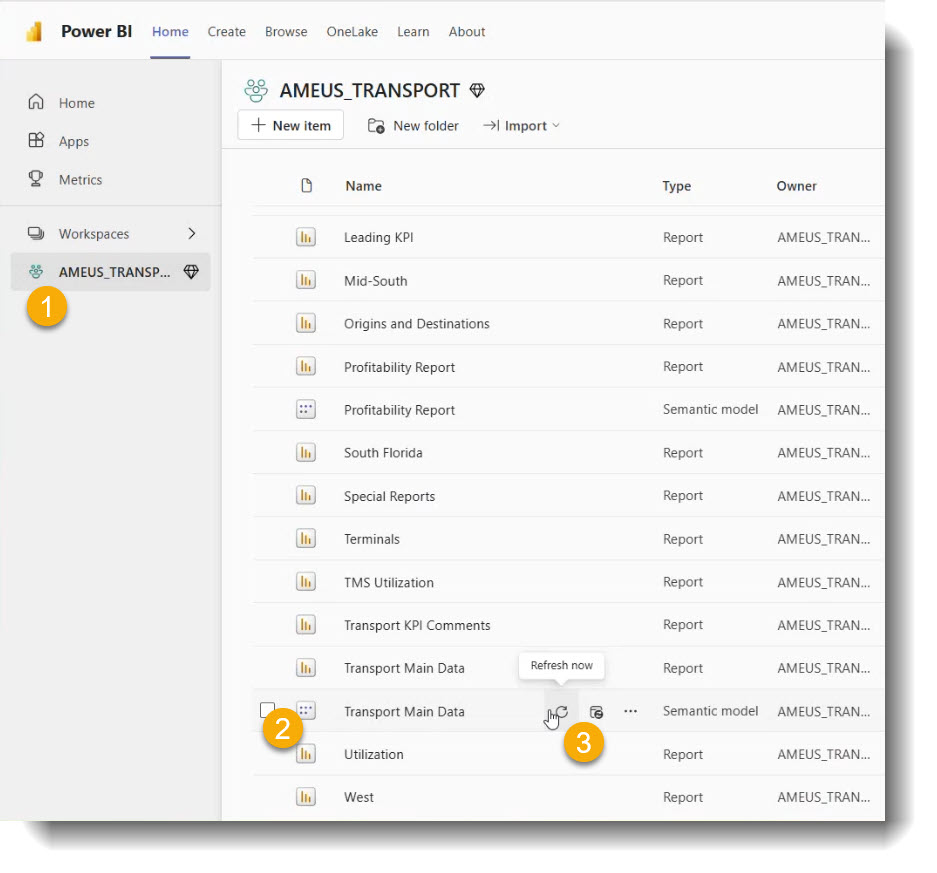
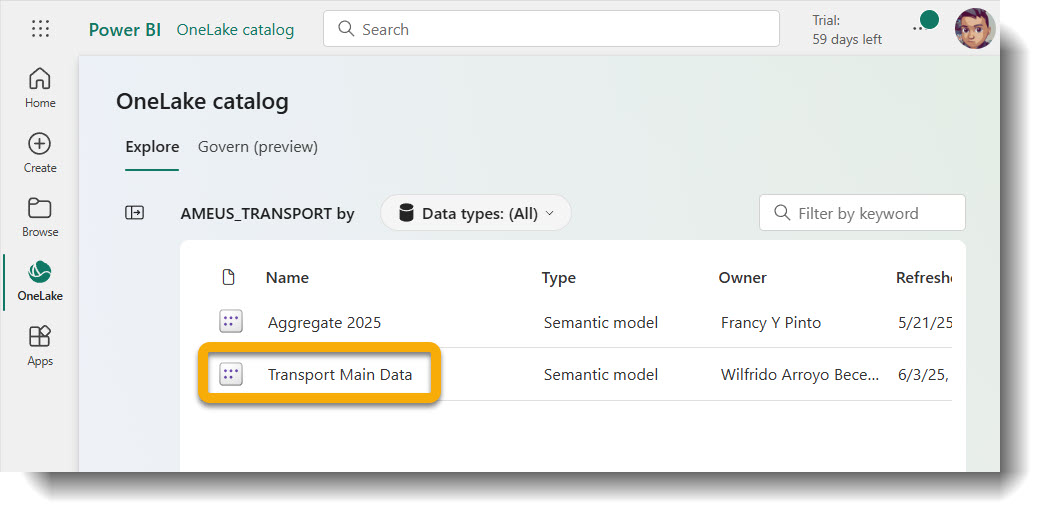
Look for Transport Main data (Semantic layer) under AMEUS as shown below:
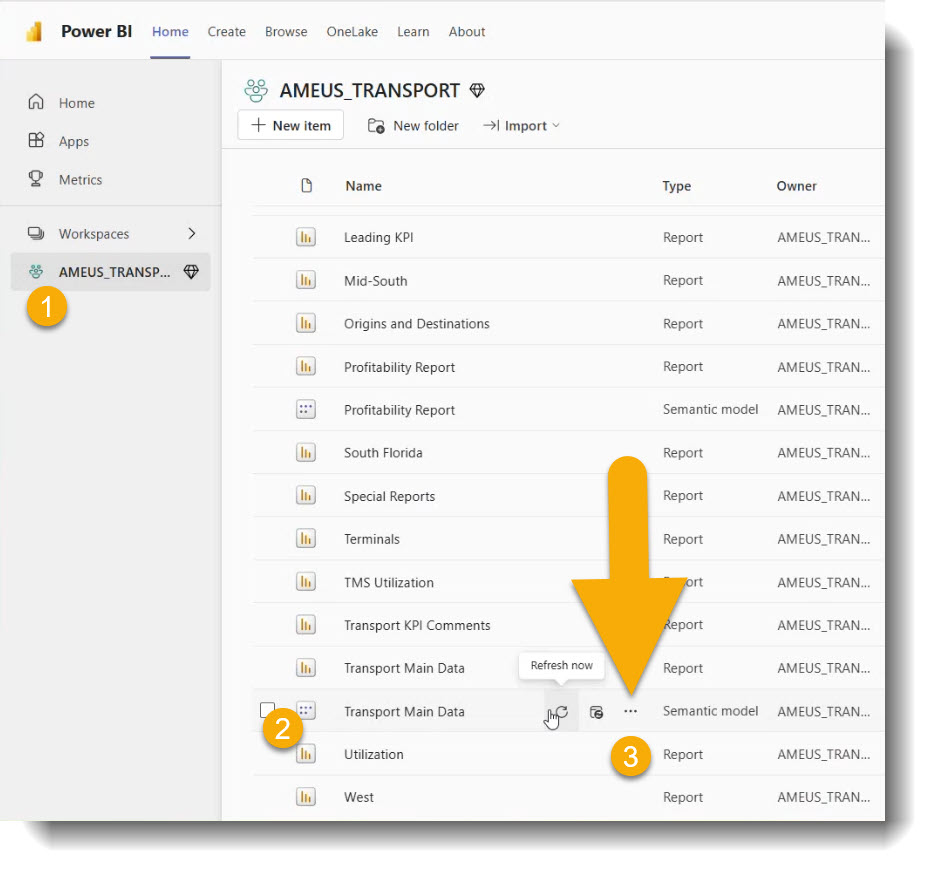
Click the three dots next to “Transport Main data” and choose “Settings”:
Refer to the connection list shown below to identify the current setup:
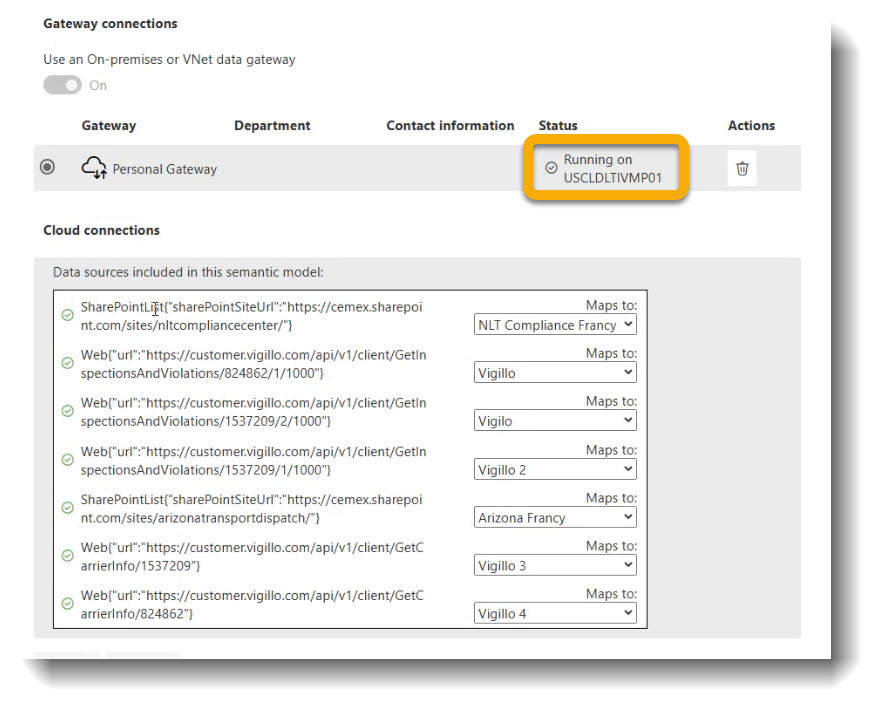
The gateway is currently running from the VM USCLDLTIVMP01. Access via RDP:
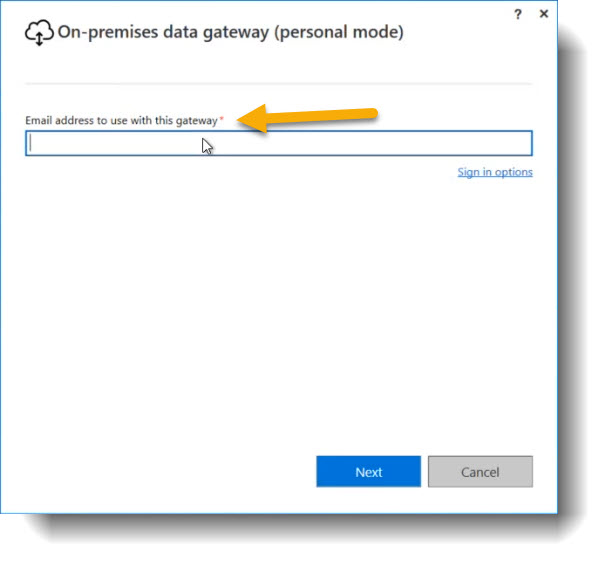
Search Windows for “personal gateway” or click the blue cloud icon.
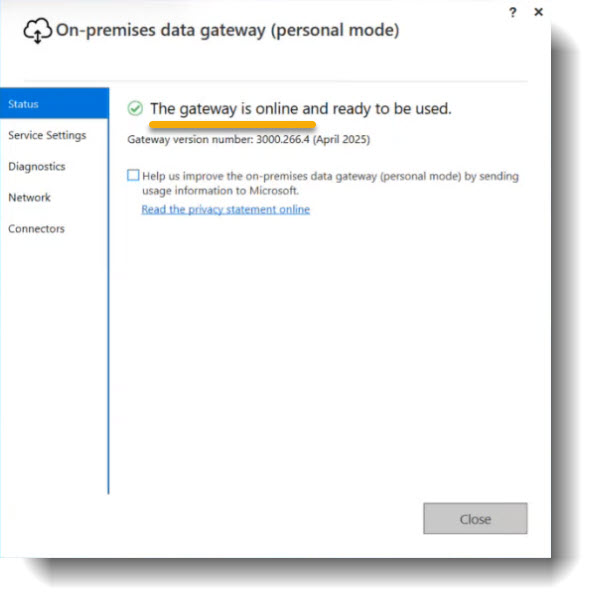
Sign in with your email address and follow prompts until the green check mark appears:
If needed, refresh the dashboard manually by navigating to the data set and clicking refresh: